Supply and DemandThis is a "Supply and Demand" script designed to help traders spot potential levels of supply (resistance) and demand (support) in the market by identifying pivot points from past price action.
Differences from Other Scripts:
Unlike many pivot point scripts, this one offers a greater degree of customization and flexibility, allowing users to determine how many ranges of pivot points they wish to plot (up to 10), as well as the number of the most recent ranges to display.
Furthermore, it allows users to restrict the plotting of pivot points to specific timeframes (15 minutes, 30 minutes, 1 hour, 4 hours, and daily) using a toggle input. This is useful for traders who wish to focus on these popular trading timeframes.
This script also uses the color.new function for a more transparent plotting, which is not commonly used in many scripts.
How to Use:
The script provides two user inputs:
"Number of Ranges to Plot (1-10)": This determines how many 10-bar ranges of pivot points the script will calculate and potentially plot.
"Number of Last Ranges to Show (1-?)": This determines how many of the most recent ranges will be displayed on the chart.
"Limit to specific timeframes?": This is a toggle switch. When turned on, the script only plots pivot points if the current timeframe is one of the following: 15 minutes, 30 minutes, 1 hour, 4 hours, or daily.
The pivot points are plotted as circles on the chart, with pivot highs in red and pivot lows in green. The transparency level of these plots can be adjusted in the script.
Market and Conditions:
This script is versatile and can be used in any market, including Forex, commodities, indices, or cryptocurrencies. It's best used in trending markets where supply and demand levels are more likely to be respected. However, like all technical analysis tools, it's not foolproof and should be used in conjunction with other indicators and analysis techniques to confirm signals and manage risk.
A technical analyst, or technician, uses chart patterns and indicators to predict future price movements. The "Supply and Demand" script in question can be an invaluable tool for a technical analyst for the following reasons:
Identifying Support and Resistance Levels : The pivot points plotted by this script can act as potential levels of support and resistance. When the price of an asset approaches these pivot points, it might bounce back (in case of support) or retreat (in case of resistance). These levels can be used to set stop-loss and take-profit points.
Timeframe Analysis : The ability to limit the plotting of pivot points to specific timeframes is useful for multiple timeframe analysis. For instance, a trader might use a longer timeframe to determine the overall trend and a shorter one to decide the optimal entry and exit points.
Customization : The user inputs provided by the script allow a technician to customize the ranges of pivot points according to their unique trading strategy. They can choose the number of ranges to plot and the number of the most recent ranges to display on the chart.
Confirmation of Other Indicators : If a pivot point coincides with a signal from another indicator (for instance, a moving average crossover or a relative strength index (RSI) divergence), it could provide further confirmation of that signal, increasing the chances of a successful trade.
Transparency in Plots : The use of the color.new function allows for more transparent plotting. This feature can prevent the chart from becoming too cluttered when multiple ranges of pivot points are plotted, making it easier for the analyst to interpret the data.
In summary, this script can be used by a technical analyst to pinpoint potential trading opportunities, validate signals from other indicators, and customize the display of pivot points to suit their individual trading style and strategy. Always remember, however, that no single indicator should be used in isolation, and effective risk management strategies should always be employed.
在脚本中搜索"THE SCRIPT"

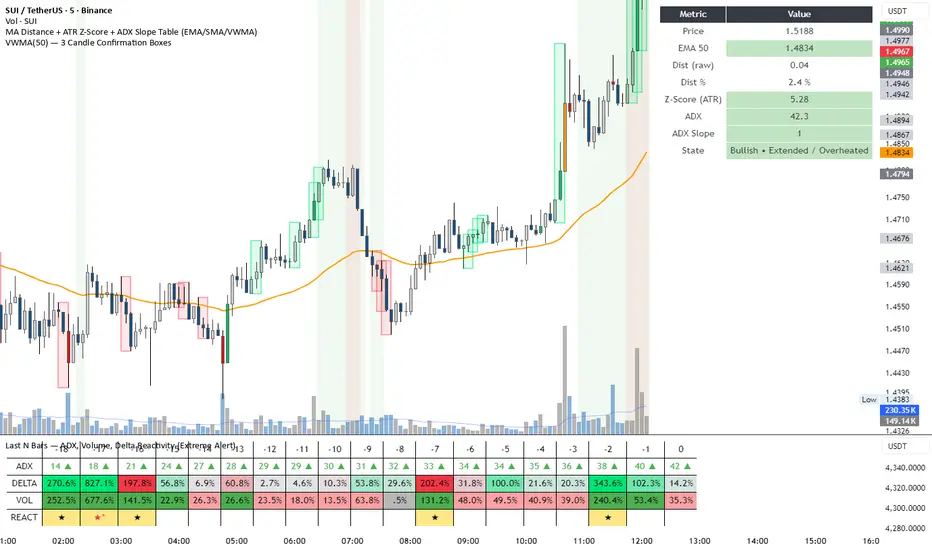
DeltaReact - Volume and Orderflow ReactivityThis indicator is designed to visualise institutional participation and directional pressure using a multi-timeframe blend of volume expansion, delta imbalance, and trend context.
Unlike traditional volume or momentum tools, it focuses on relative change rather than absolute values.
Core Concepts
The script measures:
Volume expansion relative to its own moving baseline
Delta strength derived from directional volume imbalance
Directional agreement between delta, volume, and trend state
Multi-timeframe structure, allowing lower-timeframe signals to be viewed in higher-timeframe context
What Makes This Different
Most volume-based indicators treat volume and delta independently. This tool:
Normalises both metrics into percentage-based strength
Applies contextual filters to reduce noise
Highlights structural shifts rather than raw spikes
Provides clear visual hierarchy for participation intensity
How to Use
Strong delta + volume expansion suggests active participation
Directional alignment improves confidence
Signals are designed for confluence, not standalone entries
Works across assets and sessions without instrument-specific tuning
Access & Availability
This script is published as invite-only to control distribution.
If you would like to request access or learn more about usage, please contact the author via TradingView direct message.
Important Notes
This indicator is not a trading strategy and does not provide buy or sell signals.
It is intended as a decision-support tool to be used alongside risk management and broader market analysis.
extended session - Regular Opening-Range- JayyOpening Range and some other scripts updated to plot correctly (see comments below.) There are three variations of the fibonacci expansion beyond the opening range and retracements within the opening range of the US Market session - I have not put in the script for the other markets yet.
The three scripts have different uses and strengths:
The extended session script (with the script here below) will plot the opening range whether you are using the extended session or the regular session. (that is to say whether "ext" in the lower right hand corner is highlighted or not.). While in the extended session the opening range has some plotting issues with periods like 13 minutes or any period that is not divisible into 330 mins with a round number outcome (eg 330/60 =5.5. Therefore an hour long opening range has problems in the extended session.
The pre session script is only for the premarket. You can select any opening range period you like. I have set the opening range to be the full premarket session. If you select a different session you will have to unselect "pre open to 9:30 EST for Opening Range?" in the format section. The script defaults to 15 minutes in the "period Of Pre Opening Range?". To go back to the 4 am to 9:30 pre opening range select "pre open to 9:30 EST for Opening Range?" there is no automatic 330 minute selection.
The past days offset script only works in 5 min or 15 minute period. It will show the opening range from up to 20 days past over the current days price action. Use this for the regular session only. 0 shows the current day's opening range. Use the positive integers for number of days back ie 1, 2, 3 etc not -1, -2, -3 etc. The script is preprogrammed to use the current day (0).
Scripts updated to plot correctly: One thing they all have in common is a way of they deal with a somewhat random problem that shifts the plots 4 hours in one direction or the other ie the plot started at 9:30 EST or 1:30PM EST. This issue started to occur approximately June 22, 2015 and impacts any script that tried to use "session" times to manage a plot in my scripts. The issue now seems to have been resolved during this past week.
Just in case the problem reoccurs I have added a "Switch session plot?" to each script. If the plot looks funny check or uncheck the "Switch session plot?" and see the difference. Of course if a new issue crops up it will likely require a different fix.
I have updated all of the scripts shown on this chart. If you are using a script of mine that suffers from the compiler issue then you will find an update on this chart. You can get any and all of the scripts by clicking on the small sideways wishbone on the left middle of the chart. You will see a dialogue box. Then click "make it mine". This will import all of the scripts to your computer and you can play around with them all to decide what you want and what you don't want. This is the easiest way to get all of the scripts in one fell swoop. It is also the easiest way for me to make all of the scripts available. I do not have all of the plots visible since it is too messy and one of the scripts (pre OR) is only for the regular session. To view the scripts click on the blue eye to the right of the script title to show it on this script. If you can only use the regular session. The scripts will all (with the exception of the pre OR) work fine.
If for any reason this script seems flakey refresh the page r try a slightly different period. I have noticed that sometimes randomly the script loves to return to the 5 min OR. This is a very new issue transient issue. As always if you see an issue please let me know.
Cheers Jayy

Options Series - Dynamic Support & Resistance
🌟 Key Features & How It Works:
⭐ Dynamic Support and Resistance Management:
The script dynamically calculates and draws support and resistance lines based on pivot highs and pivot lows. Unlike static levels that remain unchanged, these lines are updated in real-time. When a support or resistance level is breached, the corresponding line is automatically deleted, keeping the chart clean and relevant. This feature ensures that the trader is always looking at valid support and resistance levels based on the current price action.
⭐ Use of Arrays for Line Management:
The script utilizes arrays to store and manage support and resistance lines (array.new_line(0)). This is a more advanced feature of Pine Script v5, allowing for efficient handling of multiple lines on the chart. By using arrays, the script can easily track and manipulate multiple lines (adding, removing, updating), ensuring that the chart remains optimized for real-time analysis.
⭐ Customizable Inputs for Flexibility:
The script includes user inputs for the pivot length and the line width, making it adaptable to different trading styles and preferences. The pivot length determines how sensitive the indicator is to price changes, while the line width allows traders to customize the visual representation of support and resistance levels. These inputs add flexibility and make the script accessible to a broad range of traders.
⭐ Efficient Breach Detection Mechanism:
The isBreached function is a key part of the script. It checks whether the current price has breached any of the existing support or resistance levels. If a breach is detected (i.e., the price crosses below a support or above a resistance), the respective line is deleted, ensuring that only active and valid lines remain on the chart. This automatic update feature reduces the need for manual intervention, helping traders stay focused on key price levels.
⭐ Visual Clarity and Chart Cleanliness:
By deleting breached lines, the script ensures that the chart does not become cluttered with outdated or irrelevant lines. This visual clarity is crucial for traders who rely on clean, simple charts for decision-making. Removing unnecessary information helps traders make faster, more confident decisions based on the current market structure.
⭐ Scalability for Multiple Timeframes:
The use of pivot points makes the script adaptable to different timeframes, from intraday scalping to longer-term swing trading. By changing the pivot length, traders can optimize the indicator for different market environments, ensuring that it can be applied across various asset classes and timeframes.
⭐ Practical for Range-bound and Breakout Trading:
This script is particularly effective for traders who focus on range-bound markets or breakout strategies. It allows them to quickly identify areas where price is likely to reverse (support/resistance) or break out (when support/resistance is breached), providing real-time insight into market dynamics.
⭐ Simplification of Price Action Analysis:
By automating the calculation of pivots and management of support/resistance levels, the script simplifies price action analysis. Traders no longer need to manually draw or monitor these levels, which is a common task in technical analysis. This provides an edge, as it reduces the time spent on chart preparation and helps focus on executing trades.
⭐ Originality:
The script "Options Series - Pivot Based Support & Resistance" is an original approach to generating support and resistance levels using pivot points. Pivot-based techniques are popular, but the script introduces an automated dynamic way of drawing support and resistance lines, tracking breaches, and deleting lines when they are no longer valid. This aspect adds a refreshing layer of interactivity and functionality that sets it apart from basic pivot point scripts. The use of arrays to store and manage multiple support and resistance lines is also a good application of Pine Script’s newer array functionalities.
⭐ Uniqueness of the Script:
The script stands out due to its dynamic management of support and resistance lines. Unlike traditional scripts that simply plot static pivot points, this one evolves with the market by removing broken levels, ensuring only valid support and resistance lines are visible on the chart. This is particularly useful for traders who focus on clean charting. The use of arrays to store and manage the lines, alongside the efficient deletion of lines when breached, demonstrates a solid understanding of Pine Script v5's advanced features, such as array manipulation.
🚀 Conclusion:
This script stands out for its real-time adaptability, dynamic support/resistance management, and efficient use of Pine Script’s advanced features. It a powerful tool for both novice and advanced traders.
The script is an indicator designed to draw support and resistance levels based on pivot highs and lows, dynamically removing lines when they are breached. If a price crosses a support or resistance level, the respective line is deleted, ensuring the chart reflects the current state of support and resistance accurately.

Auto Harmonic Pattern - UltimateX [Trendoscope]IMPORTANT NOTE: (Read this before looking at any other thing on this indicator)
This indicator is created to supersede existing Auto-Harmonic-Pattern-Ultimate-Trendoscope invite only script. The script deviates a lot from the original Auto Harmonic Patterns Ultimate script in terms of number of available patterns, trading type and few other things. Hence, instead of updating the existing script, we have just decided to release as new script. Few FAQs in this regard are as below
What it means for users of AHPU and new users?
▶ Subscription of this script is not sold separately, but will be offered along with existing AHPU script. Meaning, there will be single subscription for both scripts together.
▶ All existing subscribers of AHPU will also get access to this script for the duration of their subscription term. Will start adding access to users starting from lifetime subscribers first.
▶ Any new subscriptions to AHPU will also get access to both the scripts together. We will eventually look to phase out existing AHPU once users are accustomed to new script and any possible bugs are resolved.
▶ Any trial requests will also get access to both scripts. You can request trial even if you have recently requested trial for AHPU.
Why did we create new script instead of updating the existing one?
▶ As mentioned before, this script deviates a lot from the original AHPU. Hence, it is released as new version to make sure smoother transition of users. If anyone is not comfortable using the new version, they can continue using the existing AHPU script until things settle down.
▶ Since the script is new implementation, it may also have initial bugs. It will help us resolve it in more streamlined way.
What are the main differences between these scripts?
▶ Uses single zigzag instead of multi as algorithm is further improved to detect almost everything using single zigzag.
▶ More number of patterns added. But, new patterns are disabled by default as some of them have very wide PRZ. Users can enable it via settings.
▶ Trading type with trailing entry - With wide PRZs, we also had to implement different method for calculating entry/stop. This is explained later in the script.
▶ Matrix implementation and enhanced stats - Entire implementation is redesigned to use matrix data structure instead of arrays. This allows lots of possibilities including enhanced closed trade stats.
▶ Support/Resistance widget is removed as it is proving to be bit of overhead. Users can make use of Support Resistance widget script which is a free to use script instead.
Let's get to the details of indicator now.
🎲 Indicator Components
🎯 Patterns Covered
● Classic Patterns
Gartley
Bat
Butterfly
Crab
Deep Crab
Cypher
Shark
Nenstar
● Anti/Alternate Patterns
Anti Nenstar
Anti Shark
Anti Cypher
Anti Crab
Anti Butterfly
Anti Bat
Anti Gartley
Navarro200
● Non-Standard Patterns (Disabled by default)
Five Zero
Three Drives
White Swan
Black Swan
Sea Pony
Leonardo
121
Snorm
Total
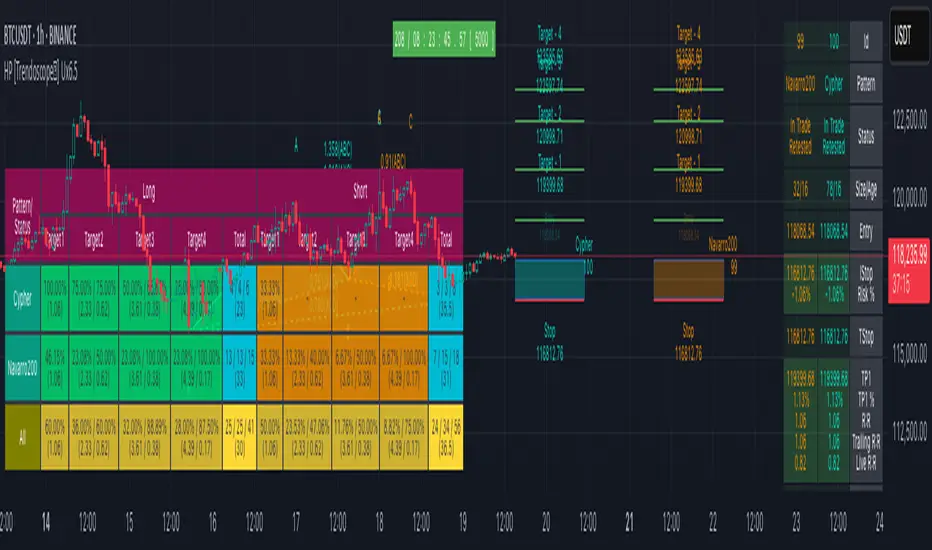
Below is a quick snapshot of indicator components.
Now, lets look at some of the individual components:
🎯 Open trade stats helps recognise trades in motion.
Apart from regular stats, it also contain different types of risk reward ratios.
Regular RR : RR calculated from entry to reach target with initial stop for risk consideration
Trailing RR : This is RR calculated for price to reach from one target to next target considering trailing stop for calculating risk
Live RR : This is calculated based on current price as entry and with given targets and stop levels. Live RR will be blank for targets which are already reached.
Targets are calculated only when entry is made. Hence, target details are not shown for patterns where it is still awaiting entry.
🎯 Closed trade stats helps understand historical performance of patterns.
By default closed stats are displayed in Compact mode. Which means, only total stats are shown. But, users can change this to show detailed stats via settings. Detailed stats take up entire screen most of the time. So, keep them only if it is required.
Closed stats present average Risk Reward, Trailing Risk Reward, Average Win Rate, and Average Trailing Win Rate for all the possible levels. As discussed before.
Regular RR : RR calculated from entry to reach target with initial stop for risk consideration
Trailing RR : This is RR calculated for price to reach from one target to next target considering trailing stop for calculating risk
Win Rate : Simple win rate calculation based on number of patterns reached target and number of valid patterns.
Trailing Win Rate : This is win rate calculated based on previous target to current target.
For example, if there are 48 valid patterns and out of which 24 patterns reach target1 and 12 patterns out of 24 reach target 2
Target1 WR : 50% (24/48)
Target1 TWR : Not applicable as there is no target before Target1
Target2 WR : 25% (12/48)
Target2 TWR : 50% (12/24)
🎲 Settings
Tooltips are provided to help with each and every settings. And they are as below.
🎲 Fully Customisable Alerts - Placeholders
Alerts are created via alert() method of pine. Hence, users will not see message box for alert template on alert widget.
Instead alerts widget look something like this:
To overcome this issue, script provides alert template placeholders as part of settings. In settings, you can already see Alert section where you can enable/disable alerts for different events.
▶ New Pattern Detection
▶ Entry Reached
▶ Target1-4 Reached
▶ Stop price reached
▶ Trade Complete - either by stop or reaching target 4
You can use following placeholders in the given text boxes to create your own alert template.
🎯 Common placeholders which are applicable for all alerts
{type} - Alert Type
- New Harmonic Pattern
- Harmonic Pattern Status Update
- Harmonic Pattern Trade Closure
{id} - Pattern Id. This is not fully unique id. But, this will be unique for all open trades. Once trade is closed, Ids are reused whenever feasible.
{ticker} - Ticker information
{timeframe} - Timeframe information
{price} - Current close price
{patterns} - Possible patterns for the projections or PRZ.
{direction} - Trade direction - Bullish or bearish
{entry} - Calculated entry for pattern
{stop} - Calculated stop for pattern
{tstop} - Trailing stop for the pattern in trade
{target1} - Target1 for pattern in trade
{target2} - Target2 for pattern in trade
{target3} - Target3 for pattern in trade
{target4} - Target4 for pattern in trade
🎯 There are few specific placeholders, which are applicable for some alert types.
Harmonic Pattern Status Update
{status} - Status of the Pattern in trade
{laststatus} - Previous status of the Pattern in trade
Harmonic Pattern Trade Closure
{result} - Trade result upon closure
付费脚本
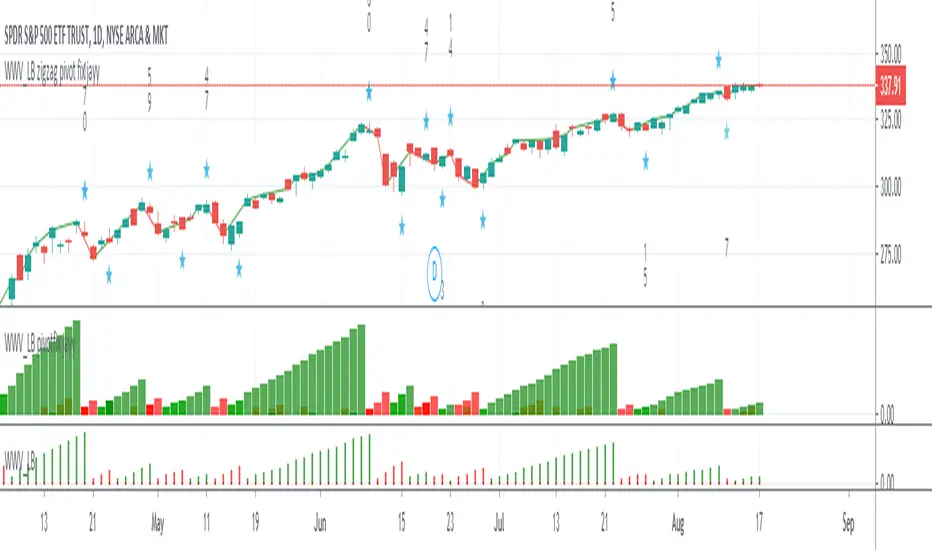
WWV_LB zigzag pivot fix jayyThis is a zigzag version of LazyBear's WWV_LB. In order to plot the WWV_LB as a zigzag, it made sense to me to set the zigzag pivot at the true WWV_LB low or high pivot bars as opposed to the "pivot" bars plotted by the original WWV_LB script. The pivot point identified in the WWV_LB script is actually the point at which a wave reversal is confirmed as opposed to the true script pivot point. Confirmation of a wave reversal can, at times, lag the true pivot by a few bars especially as trendDetectionLength values increase above "1". The WWV_LB script calculates cumulative volume from wave reversal confirmation bar to wave reversal confirmation bar as opposed to the actual/true WWV_LB reversal pivot bar to reversal pivot bar. As such the waves plotted by the original and this pivot fixed scripts not only look slightly different but can also have different cumulative volumes. Confirmation of a wave reversal can lag a few bars behind the true pivot point.
The following critical lines of the original WWV_LB script determine when a wave reverses, both the true pivot and the confirmation point:mov = close>close ? 1 : close
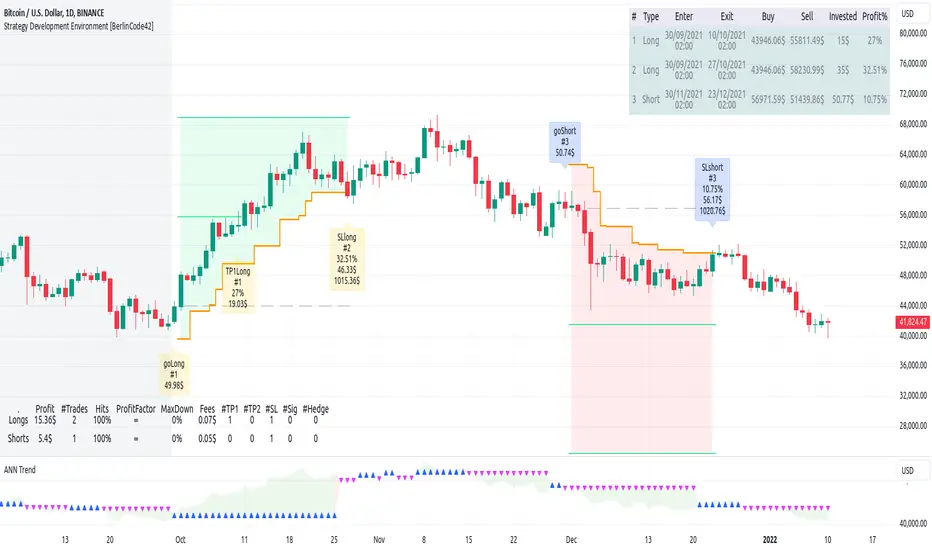
Strategy Development Environment [BerlinCode42]Happy Trade,
Intro
What is New
Algebraic/Boolean Equation
Instruction Set for The Algebraic/Boolean Equation
Example
Usage
Settings Menu
Declaration for Tradingview House Rules on Script Publishing
Disclaimer
Conclusion
1. Intro
This is a rich equipped fork of my previous "Backtest any Indicator v5". And serves as the fitting backtester and trade strategy creation tool for my upcoming ANN Indicators (artificial neural network).
As the previous version this script has no trade signal generating code. The trade signals comes in by the five user settable input slots where the user plug-in external indicators. The final trade siganls go long etc are defined by a algebraic/boolean equation typed in as text in 4 terminals as shown in Image 0 . With this algebraic/boolean equations input the user can setup any trade logic as complex and fast and easy as never seen before here on TradingView.
Image 0
2. What is new
Input algebraic/boolean equations in text-form for go long, go short, exit long & exit short
Five input slots for external indicator signals
Equation tester
User settable signal delay for enter and exit trades
User selectable alternating trades filter
User settable exit long = enter short
Intrabar or trade only on bar closing
Time filter with duration input
User settable UTC Adjustment
Long and short trades possible
Two Take Profits with quantity setting
Trailing Stop
Webhook connection
3. Algebraic/Boolean Equation
This is where the magic happens. Unlike other backtesters that rely on drop-down menus to define trade signal equations—thus limiting the number of input signals and the complexity of logic—this script uses a string interpreter to solve equations. With this, you can develop your trade logic equations and add signals or conditions simply by writing them down in algebraic/boolean form.
The instruction set for this interpreter includes not only external input signals but also several internal values. These include BarTime, BarIndex, Open, High, Low, Close, True Range, Minimal Tick, Volume, and a signal that indicates whether there is an open trade (long, short, or none). You can also reference the values of past bars for all these inputs and, of course, use constant values in your equations. There is a sad limitation: Only one past bar value per equation is practicable. If you use more, errors can occur. It seems to be caused by the pipe line architecture of the parallel computing. In any attempt to solve this issue an older function call result was hand over.
The implemented functions cover a wide range of algebraic and boolean operations. A boolean "true" is represented by all values greater than zero, while "false" is represented by zero or values less than zero.
4. Instruction set for the Algebraic/Boolean Equation
There are functions that accept either two input values or one input value. The general form is (XandY) or (notX), where X and Y can be any input slot, predefined value, constant, or another sub-equation. Functions are always written in lowercase, while input slots and predefined values use uppercase letters.
Each sub-equation must be enclosed in parentheses, e.g., (A+B). Without proper use of parentheses, the interpreter cannot determine which function to calculate first. Negative constants must be expressed by subtracting from zero (e.g., (0-3.14)), so careful attention is required.
Here are some examples that demonstrate both incorrect and correct notations:
incorrect correct
(A+B*C) (A+(B*C))
(A+B+D+E) (A+(B+(D+E)))
(-20>A) ((0-20)>A)
(A*-B) (A*(0-B))
(AnotB) (Aand(notB))
ABS(a-b) (abs(A-B))
The correct usage ensures the interpreter calculates in the intended order.
And here comes the complete Instruction Set:
Addition: (A+B)
Subtraction: (A-B)
Multiplication: (A*B)
Division: (A/B)
Absolut value: (absA)
Power of: (A^B)
Natural Logarithm: (logA)
Lowest value of Low of last x bars: (lotx)
Highest value of High of last x bars: (hotx)
Modulo, Remainder of a Division: (A%B)
Round: (rndA)
round to ceil: (ceiA)
Round to floor: (floA)
Round to next minimal tick: (mitA)
EMA of A of last 3 bars: (e03A)
EMA of A of last 7 bars: (e07A)
EMA of A of last 10 bars: (e10A)
EMA of A of last 20 bars: (e20A)
EMA of A of last 50 bars: (e50A)
Smaller then: (AB)
Equal to: (A==B)
Unequal to: (A!=B)
And: (AandB)
Or: (AorB)
Exclusive Or: (AxorB)
Not: (notA)
Past bar value: (A ) ,whereby x can be 1,2,3,...,barIndex-1
Bar time: (T)
Bar index: (I)
Opening Price of Bar: (O)
Highest Price of Bar: (H)
Lowest Price of Bar: (L)
Closing Price of Bar: (C)
Min tick value for the current symbol: (K)
Trade Volume: (V)
True Range: (R)
Is Money invested: (M) ,Long position: M=1,
Short position: M=-1,
No position: M=0
Reminder: if you wanna replace A or B above don't forget the parentheses. So if you have (logA) and wanna replace A with D+F so the correct replacement would be (log(D+F)).
In the following there are some examples of popular bar patterns and useful filters:
Doji: ((abs(O-C))<(10*K))and((H-L)>(100*K))
green Hammer: (((H-C)<(5000*K))and(((O-L)/2)>(abs(O-C)))
Up trend: (C>(e10H))
Down trend: (C<(e10L))
cool down 7 bars: (( any buy condition )and((e07(absM))==0))
possible Pivot High: (H==(hot30))and((CC))
possible Pivot Low: (L==(lot30))and((C>H )or(O0)), goShort ((A>0)and((A )<0)), Enter Signal delay=0, Exit Signal delay=0, Alternate Trades=true
take profit 1 =0.4% (30%), take profit 2 =0.7%, trailing stop loss=0.2%, intrabar, start capital=1000$, qty=5%, fee=0.05%, no Session Filter
Image 1
6. Usage
First you need to attach some signals from external Indicators. In the example above we use the Stochastic RSI indicator from TradingView. Load the Stochastic RSI indicator to the chart. Then you go to the settings menu of this script, choose in the drop-down menu of Input A the signal .
In case you wanna use a signal which is not in the drop-down menu of Input A do the following:
1) You need to know the name of the boolean (or integer) variable of your indicator which hold the desired signal. Lets say that this boolean variable is called BUY. If this BUY variable is not plotted on the chart you simply add the following code line at the end of your pine script.
For boolean (true/false) BUY variables use this:
plot(BUY ? 1:0,'Your buy condition hold in that variable BUY',display = display.data_window)
And in case your script's BUY variable is an integer or float then use instate the following code line:
plot(BUY ,'Your buy condition hold in that variable BUY',display = display.data_window)
2) Probably the name of this BUY variable in your indicator is not BUY. Simply replace in the code line above the BUY with the name of your script's trade condition variable.
3) Do the same procedure for your SELL variable. Then save your changed Indicator script.
4) Then add the changed Indicator script from step before and this backtester script to the chart ...
5) and go to the settings of it. Choose under "Settings -> Input A " your Indicator. So in the example above choose .
The form is usually: ' : BUY'. Then you see something like Image 1
6) Decide about each trade logic for Go Long and Go Short . In this Example we use for GoLong if "Stoch RSI: K" is smaller then 20. The "Stoch RSI: K" we already loaded it in input A. So we set under Go Long (A<20) and set Enter Signal Delay to 0.
Now we setup Go Short if "Stoch RSI: K" is bigger then 80. So we set under Go Short A>80. Enter Signal Delay is already set.
7) For the Exit conditions you can choose (trailing) Stop loss or Take Profit or Exit by Indicator Signal. What ever comes first triggers the exit. If you like to use an EMA Indicator for the Exit by Indicator just load it in a free input slot B, D, E, F or use the inbuild EMA. For this example we use the inbuild EMA of the last 7 values of close. It is called by the following equation: (e07C). So to exit a long trade when the close price crossunder this EMA you have to type in Exit Long ((e07C)>C). For exit a short trade enter in Exit Short ((e07C)
[blackcat] L2 Ehlers Early Onset TrendLevel: 2
Background
John F. Ehlers introuced Early Onset Trend Indicator in Aug, 2014.
Function
In “The Quotient Transform” in Aug, 2014, John Ehlers described an early trend detection method, the idea of the quotient transform, that was designed to reduce the lag often found in other trend indicators. I provided a script with pine v4 code here for the early-onset trend-detection indicator and also describes an approach for creating a strategy based on this indicator as an example.
The entry points displayed in blue on the price chart are defined by the top Onset Trend Detector upper quotient crossing above a threshold value e.g zero or 0.25/-0.25 here in this script. In the article, Ehlers suggested using a different K value for the exit, so the exit points are determined by the lower Onset Trend Detector quotient crossing below a threshold e.g. zero or -0.25/0.25 here in this script.
Key Signal
Quotient1 --> upper quotient in yellow which determines long entry
Quotient2 --> lower quotient in fuchsia which determines short entry
long ---> long entry signal
short ---> short entry signal
Pros and Cons
100% John F. Ehlers definition translation, even variable names are the same. This help readers who would like to use pine to read his book.
Remarks
The 82th script for Blackcat1402 John F. Ehlers Week publication.
Readme
In real life, I am a prolific inventor. I have successfully applied for more than 60 international and regional patents in the past 12 years. But in the past two years or so, I have tried to transfer my creativity to the development of trading strategies. Tradingview is the ideal platform for me. I am selecting and contributing some of the hundreds of scripts to publish in Tradingview community. Welcome everyone to interact with me to discuss these interesting pine scripts.
The scripts posted are categorized into 5 levels according to my efforts or manhours put into these works.
Level 1 : interesting script snippets or distinctive improvement from classic indicators or strategy. Level 1 scripts can usually appear in more complex indicators as a function module or element.
Level 2 : composite indicator/strategy. By selecting or combining several independent or dependent functions or sub indicators in proper way, the composite script exhibits a resonance phenomenon which can filter out noise or fake trading signal to enhance trading confidence level.
Level 3 : comprehensive indicator/strategy. They are simple trading systems based on my strategies. They are commonly containing several or all of entry signal, close signal, stop loss, take profit, re-entry, risk management, and position sizing techniques. Even some interesting fundamental and mass psychological aspects are incorporated.
Level 4 : script snippets or functions that do not disclose source code. Interesting element that can reveal market laws and work as raw material for indicators and strategies. If you find Level 1~2 scripts are helpful, Level 4 is a private version that took me far more efforts to develop.
Level 5 : indicator/strategy that do not disclose source code. private version of Level 3 script with my accumulated script processing skills or a large number of custom functions. I had a private function library built in past two years. Level 5 scripts use many of them to achieve private trading strategy.
MR.Mix Market Context
MR.Mix هو نظام تحليل سياقي مبني على الجلسات، تم تطويره لدعم منهجية تداول خاصة تحمل نفس الاسم (MR.Mix).
لا يُعد هذا المؤشر دمجًا لمؤشرات مستقلة، بل إطارًا تحليليًا واحدًا يتم فيه تنسيق عدة مكوّنات داخلية للعمل معًا وفق منطق موحّد يعتمد على بنية الجلسات، سلوك السعر، واستجابة الزخم.
يعمل المؤشر كأداة تحليلية مساعدة للاستراتيجية، حيث يركّز على قراءة سياق السوق وتأكيد الحالات التي تعتمد عليها المنهجية، دون توليد إشارات تداول مباشرة أو وعود أداء.
الوظائف الرئيسية:
• تحديد افتتاح جلسة نيويورك ورسم مستويات مرجعية مشتقة من الجلسة
• تصور نطاق ما قبل الافتتاح مع تتبع القمم والقيعان بشكل تراكمي
• عرض هياكل RSI والفوليوم مدمجة داخل الشارت ومقاسة نسبةً إلى النطاق السعري الظاهر
• متوسط متحرك EMA مع خيارات تنعيم تكيفية ونطاقات تذبذب اختيارية
• جميع العناصر البصرية تُعرض بناءً على شروط سياقية وليست مرسومة بشكل ثابت
تمت حماية كود المؤشر لاعتماده على تنسيق داخلي خاص بين توقيت الجلسات، التحجيم التكيفي، ومنطق العرض الشرطي، وهو تصميم لا يمكن إعادة إنتاجه بدقة باستخدام مؤشرات Pine المفتوحة دون كشف البنية الداخلية.
شرح العناصر على الرسم البياني:
• الخطوط الأفقية تمثل مستويات مرجعية مشتقة من الجلسات
• الخطوط العمودية تشير إلى انتقالات الجلسات
• المناطق المظللة توضح نطاقات ما قبل الافتتاح
• صناديق RSI والفوليوم المدمجة تعكس الزخم والمشاركة ضمن النطاق السعري الظاهر فقط
────────────────────────────────
MR.Mix is a session-based market context system developed to support a proprietary trading methodology under the same name (MR.Mix).
This script is not a compilation of standalone indicators. It is a unified analytical framework where multiple internal components are coordinated to operate under a single logic focused on session structure, price behavior, and momentum response.
The indicator functions as a supportive analytical tool for the methodology by providing market context and condition confirmation, without generating direct trading signals or performance claims.
Key features:
• New York session open detection with session-derived reference levels
• Pre-market range visualization with cumulative high/low tracking
• Embedded RSI and Volume structures rendered directly on the price chart and scaled relative to the visible price range
• EMA with optional adaptive smoothing and volatility bands
• All visual elements are condition-driven and context-aware rather than continuously plotted
The script is protected because it relies on proprietary coordination between session timing, adaptive scaling, and conditional rendering logic that cannot be accurately replicated using standard open-source Pine indicators without exposing internal structure.
Chart elements:
• Horizontal lines represent session-derived reference prices
• Vertical lines mark session transitions
• Shaded areas define pre-market price boundaries
• Embedded RSI and Volume boxes reflect momentum and participation within the visible range only

MR.MixMarket Context
MR.Mix هو نظام تحليل سياقي مبني على الجلسات، تم تطويره لدعم منهجية تداول خاصة تحمل نفس الاسم (MR.Mix).
لا يُعد هذا المؤشر دمجًا لمؤشرات مستقلة، بل إطارًا تحليليًا واحدًا يتم فيه تنسيق عدة مكوّنات داخلية للعمل معًا وفق منطق موحّد يعتمد على بنية الجلسات، سلوك السعر، واستجابة الزخم.
يعمل المؤشر كأداة تحليلية مساعدة للاستراتيجية، حيث يركّز على قراءة سياق السوق وتأكيد الحالات التي تعتمد عليها المنهجية، دون توليد إشارات تداول مباشرة أو وعود أداء.
الوظائف الرئيسية:
• تحديد افتتاح جلسة نيويورك ورسم مستويات مرجعية مشتقة من الجلسة
• تصور نطاق ما قبل الافتتاح مع تتبع القمم والقيعان بشكل تراكمي
• عرض هياكل RSI والفوليوم مدمجة داخل الشارت ومقاسة نسبةً إلى النطاق السعري الظاهر
• متوسط متحرك EMA مع خيارات تنعيم تكيفية ونطاقات تذبذب اختيارية
• جميع العناصر البصرية تُعرض بناءً على شروط سياقية وليست مرسومة بشكل ثابت
تمت حماية كود المؤشر لاعتماده على تنسيق داخلي خاص بين توقيت الجلسات، التحجيم التكيفي، ومنطق العرض الشرطي، وهو تصميم لا يمكن إعادة إنتاجه بدقة باستخدام مؤشرات Pine المفتوحة دون كشف البنية الداخلية.
شرح العناصر على الرسم البياني:
• الخطوط الأفقية تمثل مستويات مرجعية مشتقة من الجلسات
• الخطوط العمودية تشير إلى انتقالات الجلسات
• المناطق المظللة توضح نطاقات ما قبل الافتتاح
• صناديق RSI والفوليوم المدمجة تعكس الزخم والمشاركة ضمن النطاق السعري الظاهر فقط
────────────────────────────────
MR.Mix is a session-based market context system developed to support a proprietary trading methodology under the same name (MR.Mix).
This script is not a compilation of standalone indicators. It is a unified analytical framework where multiple internal components are coordinated to operate under a single logic focused on session structure, price behavior, and momentum response.
The indicator functions as a supportive analytical tool for the methodology by providing market context and condition confirmation, without generating direct trading signals or performance claims.
Key features:
• New York session open detection with session-derived reference levels
• Pre-market range visualization with cumulative high/low tracking
• Embedded RSI and Volume structures rendered directly on the price chart and scaled relative to the visible price range
• EMA with optional adaptive smoothing and volatility bands
• All visual elements are condition-driven and context-aware rather than continuously plotted
The script is protected because it relies on proprietary coordination between session timing, adaptive scaling, and conditional rendering logic that cannot be accurately replicated using standard open-source Pine indicators without exposing internal structure.
Chart elements:
• Horizontal lines represent session-derived reference prices
• Vertical lines mark session transitions
• Shaded areas define pre-market price boundaries
• Embedded RSI and Volume boxes reflect momentum and participation within the visible range only

Cloud Channel Indicators [Quantigenics]The "Cloud Channel Indicators " script forms an integral part of a sophisticated trading approach, offering in-depth market analysis through its High Precision Oscillator and Trend Bias Indicator. These components provide traders with nuanced insights into market momentum and overall trend direction, making them invaluable for informed trading decisions. This script is further enhanced when used alongside its intended counterpart, the "Cloud Channel Signals " script, which displays the “cloud” indicator and Buy/Sell signals on charts. This combination creates a comprehensive and integrated trading system, suitable for various market conditions and trading styles.
The "Cloud Channel Indicators” script is a detailed trading indicator that merges advanced data analysis techniques with user-customizable features. It combines oscillators, dynamic levels, trend bias, and color settings, allowing users to tailor its functionality and visual representation. Unique to this script is its use of Gaussian and Rational Quadratic kernel estimates for data smoothing, enhancing the calculation of oscillator values. It dynamically adjusts OverBought and OverSold levels based on the oscillator's behavior and leverages array operations for tracking market peaks and lows. The script also integrates a Trend Bias indicator using highest highs, lowest lows, and exponential moving averages (EMAs), all of which are displayed through a range of plotting and visual elements. This synthesis of sophisticated techniques provides a multifaceted tool for technical market analysis.
As with all of our scripts, the "Cloud Channel Indicators"script, is designed to work on ANY symbol and time frame. The input parameters can be adjusted to fit your specific trading style.
Technical Composition :
High Precision Oscillator : This component focuses on capturing market momentum and identifying critical turning points. It uses advanced kernel-based estimations combined with a unique oscillator line and signal line setup to pinpoint market extremes, offering traders insights into potential entry and exit points.
Trend Bias Indicator : This indicator offers a broad view of the market's overall direction. It employs a combination of high and low-price averages, smoothed with an EMA, to indicate the prevailing market trend. The indicator is essential for verifying and complementing the insights provided by the High Precision Oscillator, ensuring that trades align with the broader market trend.
How to Use :
Integration with "Cloud Channel Signals" Script : For optimal use, synchronize this script with the "Cloud Channel Signals " script. This is essential for the script to provide meaningful analysis and insights.
Please note: The signals and cloud indicator displayed in this screenshot are part of the companion 'Cloud Channel Signals' script, which is not included in the 'Cloud Channel Indicators' script you are currently viewing.
The 'Cloud Channel Signals' script can be found here:
Analyzing Market Momentum with High Precision Oscillator : Utilize the High Precision Oscillator to identify market momentum and critical turning points. Look for extreme values on the oscillator line and signal line to pinpoint potential entry and exit points.
Understanding Market Trend with Trend Bias Indicator : Use the Trend Bias Indicator to get a broad view of the market's overall direction. This indicator helps confirm the insights provided by the High Precision Oscillator, aligning trades with the market trend.
Customizing Indicator Settings : Tailor the script to your trading style by adjusting the input parameters such as Oscillator Length, Trend Bias Length, and levels for top and bottom bounds. Ensure these settings match those in the "Cloud Channel Signals" script.
Interpreting Oscillator and Trend Bias : Monitor the High Precision Oscillator for overbought or oversold conditions. Use the Trend Bias Indicator to determine if the market is in an uptrend or downtrend and align your trades accordingly.
Using Dynamic Levels : Activate the Dynamic Level feature for an adaptive analysis that adjusts to current market conditions.
Visual Analysis : Pay attention to the color changes and histogram patterns in the script's visualization to quickly assess market conditions and momentum.
Risk Management : Combine these insights with proper risk management strategies, adjusting positions based on oscillator extremes and trend bias indications. Additionally, further risk management and stop loss levels are provided when used with the "Cloud Channel Signals” script (see description for "Cloud Channel Signals”)
Input Parameter Settings :
Important Usage Guidance : For seamless integration with its counterpart, the "Cloud Channel Signals" script, it's crucial to align the input parameter settings across both scripts. When adjusting values from their defaults, ensure that corresponding parameters in both scripts are identically set. This synchronization is key to achieving a cohesive and accurate representation on your charts.
Show Indicator Name (ShowName) : Toggles the display of the indicator names on the chart.
Show Oscillator Indicator (ShowOscillator) : Controls the visibility of the High Precision Oscillator.
Oscillator Length (OscillatorLength) : Sets the period for the oscillator's kernel estimation.
Top Level and Bottom Level (TopLevel, BottomLevel) : Defines the upper and lower bounds for the oscillator, indicating overbought and oversold conditions.
Dynamic Level Toggle (Dynamic_Level_OnOff) : Enables the use of dynamic levels for more adaptive analysis.
Show Trend Bias Indicator (ShowTrendBias) : Toggles the display of the Trend Bias Indicator.
Trend Bias Length (TrendBiasLength) : Adjusts the calculation period for the Trend Bias Indicator.
Show Peak/Valley EMA Lines (ShowEmaLines) : Controls the display of additional EMA lines for peak and valley analysis.
Color Customization : Offers options to customize the color of various elements like Top Level, Bottom Level, Zero Line, and more. These parameters provide traders with extensive control and customization of the indicators, allowing for tailored analysis and application in various market conditions and trading styles.
The "Cloud Channel Indicators " script is a versatile and advanced tool designed for traders who seek a deep understanding of market trends and momentum. Its combination of the High Precision Oscillator and Trend Bias Indicator offers a multi-dimensional view of market behavior. The scripts was designed and intended to be used with the "Cloud Channel Signals " script, which complements the "Cloud Channel Indicators" by showing the “cloud” indicator as well as Buy/Sell signals on the charts.
Traders are advised to familiarize themselves with the functionalities of these indicators for effective application in their trading strategies. As with all trading tools, remember that trading involves risk and past performance is not indicative of future results.
You can see the “Author’s instructions" below to get immediate access to Cloud Channel Indicators & the rest of the “Quantigenics Premium Indicator Suite.
Counting Stars Overlay [Market Overview Series]Hi fellow tradeurs,
So it's always been my goal to provide one of my best scripts. This is from what I call my "Market Overview" series. It is a scanner for my second best script to date. Market Overview bc of its origins as a scanner of the Kucoin Margin Coins. I realize that there are more coins that there are more margin coins that Kucoin has but I wanted to have a solid 40 coins on each coin "set". If you are unfamiliar with what I mean by 'sets' then you can view my other scanner scripts on this account for futher elaboration but to sum it up....there are 4 sets of coins I have to choose from in the settings. Each set has 40 coins in them (as there is a cap of 40 security calls that can be made per each iteration of the script on the chart). That being said...if you have the capabilities then add this script 4 times to your chart and select a diff set for each copy of the script. This has the scanner in a way that I've yet to present in my others scripts. When the alert for a coin goes off then the coins name will be printed as a label over the main chart. BTW, this was built for the 1 min timeframe and have used it EXTENSIVELY and this is the best TF for how the settings are set. I will also publish another script that will be a visual aid for this one but will rather show all the plots associated with the code that is in this scanner. Know that for the scanner it'll be best to choose a coin that has at least 1 trade/update/printed candle per minute (to be safe use BTC or ETH chart or else some of the signals will be printed if the signal arrives at a point in time where the coin on the screen does not print a candle bc no new trade or update to trades occur in TradingView. For the visual aid script that I will add right after this, there will be 20 different plots that appear. When the AVG of all of these plots is beyond the OverBought line and then the AVG line is falling for 2 bars...THEN the long signal for that coin is generated (and vise versa for short signals) Lastly regarding the visual aid script, THAT ONE will ONLY show the 20 plots that are associated with the coin that the chart is selected for. So that one is not a scanner and is just a stand alone script (again) to show whats going on in the background of this scanner. Now, once you add it however many time you want to see however many sets of coins you want, I recommend merging the scales so that they are all on one scale. I prefer mine being on the left side but all you have to do is select the 3 dots in the scripts settings in the chart window and select the scale location line and it'll open another set of lines at which point you can select "merge to scale Z" (that will be the left scale) and will put all the scales together on the left. I forgot ****If you want to see a whole diff exchange's coins you much make changes to this original script and it is further described how to do so in one of my first publications**** I REALLY hope it becomes of some benefit to you in your trading as it abundantly has in my own. It is after all one of the best of my best. Ohh, I forgot to add alerts to this but will do so immediately following this. To finish, this script DOES NOT REPAINT as far as I have EVER seen (and I have extensively searched for it bc of how good the signals were, I figured I MUST HAVE made a mistake and it did so...but alas...it does not. If you notice something on the contrary do notify me immediately with the coin, exchange, TF, and time of the occurrence and we can go from there. If anyone has any great ideas for the script then please do also let me know and if I find anyone with some abilities that mingle well with my own then lets talk as I'm always looking for good ol chaps to help me out with other scripts bc if you think this is good....well....you must imagine that I've got better that I have not/am not publishing. Aaaaaanywho, goodluck to you all. I wish you the best. ***I've got good info on how to look out for false signals but I want to see what yall come up with first before I give away all my alpha.
AND if anyone asks questions that Ive already touched on in this description or already in the comments sections then maybe someone there would be willing to waste their time answering them bc I've done quite a bit of work here that I am HAPPY to hand over to the general public but if you are not willing to do the work in reading to possibly answer your inquiries that have already been answered then I am not willing to do that work for you again. Peace and love people...peace and love. Im out.
ORB Pressure (Futures) Your TradingView script is an ORB “pressure + confirmation” indicator built for futures that anchors the Opening Range to the NY cash open and then manages the day in three phases. First, it constructs the Opening Range high/low starting at 09:30 NY for a user-selectable duration (3/5/15/30/60 minutes) and draws those levels forward on the chart. Second, once the range is set, it computes a real-time break likelihood score (0–100) plus a directional lean (UP/DOWN/NEUTRAL) using a blend of factors traders care about: proximity to the OR edges, ATR-based compression, repeated “touches” near ORH/ORL, EMA stacking and VWAP positioning/slope, and relative volume vs a baseline. Third, it enforces a clean signal structure: it triggers a one-shot event only when a candle closes outside ORH/ORL, logs the break details (direction, price, ticks beyond the range, and time), and prevents repeat firing; however, if price closes back inside the range within a configurable number of candles, the script treats it as a failed break and resets so it can re-arm. A compact dashboard displays the live state (building/set/armed), score, lean, and it preserves the break statistics after a trigger so you can review the day’s breakout behavior at a glance.

Custom ORBIT GSK-VIZAG-AP-INDIA🚀 Custom ORBIT — Opening Range Breakout & Reversal Indicator
This indicator automatically calculates and plots the Opening Range (OR) high and low levels for a user-defined session and duration. It is designed to assist intraday traders by providing immediate visual signals for both price breakouts and subsequent reversals from these key levels.
The indicator is particularly suitable for markets with defined trading hours, such as the Indian indices (Nifty, Bank Nifty), given its default time settings are based on GMT+5:30.
⚙️ How It Works (Indicator Logic)
The indicator operates based on three main logical components: time definition, level calculation, and signal generation.
1. Time Session and Range Definition: All time calculations are based on GMT+5:30 (Indian Standard Time/IST). The script defines a specific trading session from a customizable start time (default 9:15 AM) to a session end time (default 3:30 PM). The Opening Range (OR) is established during the initial duration, which is set by the rangeMinutes input (default 15 minutes, meaning the OR is calculated from 9:15 AM to 9:30 AM).
2. Level Calculation and Plotting: During the initial range duration, the script captures the absolute highest price (OR High) and the absolute lowest price (OR Low). Once this period ends, two horizontal lines—a green line for the OR High and a red line for the OR Low—are drawn and automatically extended across the chart for the remainder of the active trading session. The visual style of these lines can be customized to Dotted, Dashed, or Solid.
3. Breakout and Reversal Logic: The indicator actively tracks the market's state relative to the OR levels to generate four distinct signals:
Break Up: A signal is generated when the closing price crosses over the OR High, indicating potential upward momentum.
Break Down: A signal is generated when the closing price crosses under the OR Low, indicating potential downward momentum.
Reversal Down: This yellow signal occurs only after a price has already broken above the OR High (Break Up state), and then the price moves back into the range (closing below the ORH), suggesting a failed breakout.
Reversal Up: This yellow signal occurs only after a price has already broken below the OR Low (Break Down state), and then the price moves back into the range (closing above the ORL), suggesting a failed breakdown.
💡 Suggested Use Cases
The signals generated by this indicator can be used in two primary ways:
Breakout Trading: A trader may enter a long position on a "Break Up" signal or a short position on a "Break Down" signal. A common risk management practice is to use the opposite OR level (ORL for long trades, ORH for short trades) as a stop-loss reference.
Faded Breakout / Reversal Trading: Look for the yellow "Reversal Up" or "Reversal Down" signals. These signals indicate a rejection of the OR level, and a trader may take a counter-trend position with the expectation that the price will return to the consolidation range or move toward the opposite OR level.
⚠️ Educational Disclaimer
This indicator is for educational and illustrative purposes only. It provides technical signals based on mathematical calculation of price action and should not be construed as financial advice, trading advice, or a solicitation to buy or sell any financial instrument. Trading carries a high level of risk, and you may lose more than your initial deposit. Past performance is not indicative of future results. Always consult with a qualified financial professional before making any investment decisions.

Volume Analysis🙏🏻 (signed) Volume Analysis is 2 of 2 structural layer / ordeflow analysis scripts, while the first one is Liquidity Analysis. Both are independent so can’t be released together as a single script, but should be used together.
The same math used in this script can be applied to other types of aggressive volume data: non-aggregated flow of market orders, volume traded of put vs call options.
There’s no universal agreement about terminology, but this script works with volumes signed by the aggressor who initiated a transaction. Then these volumes get aggregated by time and a cumulative sum is calculated. Mostly this is widely known as Cumulative Volume Delta.
However this script works with 'inferred' volumes vs the provided ones. It’s the better choice for equities, bonds; neutral choice for currencies; and suboptimal choice for natural and artificial commodities.
Contents:
Output description;
How to analyze & use the outputs;
How to use it together with Liquidity Analysis script;
How did I use both scripts to finish The Leap profitably and skipped many losses.
1. Output description
Color of the CVD line reflects (signed) volume imbalance state: red is negative, purple is neutral, blue is positive.
3 purple lines are lower deviation (lower band), basis (middle band), upper deviation (upper band): used to generate signals by a ruleset that would be explained in a minute
Gray number in the script’s status line is the advised input you may put into Inferred volume multiplier in script’s setting, I will explain it
Vertical dash line marks the moving window end, this way you can be certain over what exact data you see the profile was built.
2. How to analyze & use the outputs
Setup up the script:
Moving window length: set it to ~ ¼ of your data analysis window. E.g if you see on your charts and use ~ 256 bars, set the length to 64.
Inferred volume multiplier: you can easily leave it 256, this is not a critical factor for the math, it’s mostly there if you want to ~ equate inferred volumes with real ones in scale. For this, use the gray number in the script status line, it’s calculated as ratio of long term real volumes weighted avg to long term inferred volumes weighted avg.
Again, changing the inferred volume multiplier won’t affect the math.
Use 2 timeframes: main one and a far lower one 3 steps down, just like on the screenshot.
Find out current volume imbalance state:
As mentioned before, based on CVD line color, it can be negative, neutral or positive. This is the state variable that changes slowly and denies/confirms the signals generated by crossovers of CVD line and 3 purple thresholds.
For this I use my own very fast and lightweight metric that is totally statistically grounded, utilizes temporal information, and calculates volume imbalance without using heavy math like regressions as it’s usually done. It also provides a natural neutral zone, when volume imbalance is not strong enough to be confirmed.
...
CVD-based signals:
First you need to understand what precisely a touch of a threshold is:
Touch: an event when either of these 2 happens:
One CVD datapoint is above the threshold, and the next CVD datapoint is below the threshold
One CVD datapoint is below the threshold, and the next CVD datapoint is above the threshold
These are usually called crossovers/crossunders.
Now with the 3 purple thresholds we follow this logic:
Monitor the last touched threshold;
Once another threshold is touched, here we may generate a signal but only once !, after the first generated signal at that threshold we can’t generate more signals on this threshold, we need to wait when CVD comes to another threshold.
If CVD touches one threshold, and then goes down and touches another threshold downwards, we wait when CVD makes a datapoint above this threshold. When it happens, we register a long signal
If CVD touches one threshold, and then goes up and touches another threshold upwards, we wait when CVD makes a datapoint below this threshold. When it happens, we register a short signal
However, don’t open new trades against the current volume imbalance state. So don’t open shorts when the CDV line is blue, and don’t open longs when CVD line is red.
Btw, this technique I call it “reclaim” of a level/threshold. It can be applied to horizontal levels, and it’s very powerful especially when you fade levels on very volatility assets like BTC. This technique allows you to Not fade a level straight away, but wait when price goes past the level a bit, and then comes back and reclaims it, only there you enter, and moreover you now have a very well defined risk point.
The last part is multi-timeframe logic. Prefer to act when a lower timeframe is Not against the main timeframe. That’s all, no multiple higher timeframes are needed.
3. How to use it together with Liquidity Analysis script.
That script also has a mean to generate its own signals, and another state variable called Liquidity Imbalance.
So now you’re not only looking at volume imbalance but also at liquidity imbalance that would deny/confirm the CVD based signal. You need at least one of these two to favor your long or short.
This is the same logic widely used in HFT, where MM bots cancel/shift/resize orders when book is too onesided And ordeflow is one sided as well.
4. How did I use both scripts to finish The Leap profitably and skipped many losses.
Even tho you can use structural information as your main strategic layer, as many so-called orderflow traders do, I traded in objective style: my fade signals were volatility based in essence, and I used ordeflow for better entries and stops, but most importantly to skip losses.
When ‘both‘ liquidity imbalance and volume imbalance (in their main timeframes) were against my trades, I skipped them all, saving many ~$500 stop losses (that was my basis risk unit for the Leap). Unless I had a very strong objective signal, i.e. confluence of several signals, or just one higher timeframe signal, I did all these skips.
I traded ~ intraweek timeframe, so I was analyzing either the last 230 30min bars or 1380 5min bars. Both Liquidity Analysis and (signed) Volume Analysis scripts were set to moving window length 46 or 276 for either granularity.
I finished the leap with 9% profit and max DD ~ 5%, a bit short of my goal of 12.5%. If not these 2 scripts I would’ve finished a bit above breakeven I think.
,,,
Another thing, I made these 2 scripts invite-only because they are made particularly for trading, particularly for certain types of market data. These are tools adapted for particular use case, not like my other posts with general math entities like Kernel Density Estimation or Kalman filter, that you can take and apply properly on any data you need yourself.
However these are made from general math entities like everything else. ‘All’ the components are available in my other scripts, ideas, and other sources related to me. If you want to reverse-engineer these, you can find all the components you need in my already posted open source work.
∞

Realtime 5D Profile [LucF]█ OVERVIEW
This indicator displays a realtime profile that can be configured to visualize five dimensions: volume, price, time, activity and age. For each price level in a bar or timeframe, you can display total or delta volume or ticks. The tick count measures activity on a level. The thickness of each level's line indicates its age, which helps you identify the most recent levels.
█ WARNING
The indicator only works in real time. Contrary to TradingView's line of volume profile indicators , it does not show anything on historical bars or closed markets, and it cannot display volume information if none exists for the data feed the chart is using. A realtime indicator such as this one only displays information accumulated while it is running on a chart. The information it calculates cannot be saved on charts, nor can it be recalculated from historical bars. If you refresh the chart, or the script must re-execute for some reason, as when you change inputs, the accumulated information will be lost.
Because "Realtime 5D Profile" requires time to accumulate information on the chart, it will be most useful to traders working on small timeframes who trade only one instrument and do not frequently change their chart's symbol or timeframe. Traders working on higher timeframes or constantly changing charts will be better served by TradingView's volume profiles. Before using this indicator, please see the "Limitations" section further down for other important information.
█ HOW TO USE IT
Load the indicator on an active chart (see here if you don't know how).
The default configuration displays:
• A double-sided volume profile showing at what price levels activity has occurred.
• The left side shows "down" volume, the right side shows "up" volume.
• The value corresponding to each level is displayed.
• The width of lines reflects their relative value.
• The thickness of lines reflects their age. Four thicknesses are used, with the thicker lines being the most recent.
• The total value of down/up values for the profile appears at the top.
To understand how to use profiles in your trading, please research the subject. Searches on "volume profile" or "market profile" will yield many useful results. I provide you with tools — I do not teach trading. To understand more about this indicator, read on. If you choose not to do so, please don't ask me to answer questions that are already answered here, nor to make videos; I don't.
█ CONCEPTS
Delta calculations
Volume is slotted in up or down slots depending on whether the price of each new chart update is higher or lower than the previous update's price. When price does not move between chart updates, the last known direction is used. In a perfect world, Pine scripts would have access to bid and ask levels, as this would allow us to know for sure if market orders are being filled on upticks (at the ask) or downticks (at the bid). Comparing the price of successive chart updates provides the most precise way to calculate volume delta on TradingView, but it is still a compromise. Order books are in constant movement; in some cases, order cancellations can cause sudden movements of both the bid and ask levels such that the next chart update can occur on an uptick at a lower price than the previous one (or vice versa). While this update's volume should be slotted in the up slot because a buy market order was filled, it will erroneously be slotted in the down slot because the price of the chart's update is lower than that of the previous one. Luckily, these conditions are relatively rare, so they should not adversely affect calculations.
Levels
A profile is a tool that displays information organized by price levels. You can select the maximum quantity of levels this indicator displays by using the script's "Levels" input. If the profile's height is small enough for level increments to be less than the symbol's tick size, a smaller quantity of levels is used until the profile's height grows sufficiently to allow your specified quantity of levels to be displayed. The exact position of levels is not tethered to the symbol's tick increments. Activity for one level is that which happens on either side of the level, halfway between its higher or lower levels. The lowest/highest levels in the profile thus appear higher/lower than the profile's low/high limits, which are determined by the lowest/highest points reached by price during the profile's life.
Level Values and Length
The profile's vertical structure is dynamic. As the profile's height changes with the price range, it is rebalanced and the price points of its levels may be recalculated. When this happens, past updates will be redistributed among the new profile's levels, and the level values may thus change. The new levels where updates are slotted will of course always be near past ones, but keep this fluidity in mind when watching level values evolve.
The profile's horizontal structure is also dynamic. The maximum length of level lines is controlled by the "Maximum line length" input value. This maximum length is always used for the largest level value in the profile, and the length of other levels is determined by their value relative to that maximum.
Updates vs Ticks
Strictly speaking, a tick is the record of a transaction between two parties. On TradingView, these are detected on seconds charts. On other charts, ticks are aggregated to form a chart update . I use the broader "update" term when it names both events. Note that, confusingly, tick is also used to name an instrument's minimal price increment.
Volume Quality
If you use volume, it's important to understand its nature and quality, as it varies with sectors and instruments. My Volume X-ray indicator is one way you can appraise the quality of an instrument's intraday volume.
█ FEATURES
Double-Sided Profiles
When you choose one of the first two configuration selections in the "Configuration" field's dropdown menu, you are asking the indicator to display a double-sided profile, i.e., where the down values appear on the left and the up ones on the right. In this mode, the formatting options in the top section of inputs apply to both sides of the profile.
Single-Sided Profiles
The six other selections down the "Configuration" field's dropdown menu select single-sided profiles, where one side aggregates the up/down values for either volume or ticks. In this mode, the formatting options in the top section of inputs apply to the left profile. The ones in the following "Right format" section apply to the right profile.
Calculation Mode
The "Calculation" input field allows the selection of one of two modes which applies to single-sided profiles only. Values can represent the simple total of volume or ticks at each level, or their delta. The mode has no effect when a double-sided profile is used because then, the total is represented by the sum of the left and right sides. Note that when totals are selected, all levels appear in the up color.
Age
The age of each level is always displayed as one of four line thicknesses. Thicker lines are used for the youngest levels. The age of levels is determined by averaging the times of the updates composing that level. When viewing double-sided profiles, the age of each side is calculated independently, which entails you can have a down level on the left side of the profile appear thinner than its corresponding up side level line on the right side because the updates composing the up side are more recent. When calculating the age of single-sided profiles, the age of the up/down values aggregated to calculate the side are averaged. Since they may be different, the averaged level ages will not be as responsive as when using a double-sided profile configuration, where the age of levels on each side is calculated independently and follows price action more closely. Moreover, when displaying two single-sided profiles (volume on one side and ticks on the other), the age of both sides will match because they are calculated from the same realtime updates.
Profile Resets
The profile can reset on timeframes or trend changes. The usual timeframe selections are available, including the chart's, in which case the profile will reset on each new chart bar. One of two trend detection logics can be used: Supertrend or the one used by LazyBear in his Weis Wave indicator . Settings for the trend logics are in the bottommost section of the inputs, where you can also control the display of trend changes and states. Note that the "Timeframe" field's setting also applies to the trend detection mechanism. Whatever the timeframe used for trend detection, its logic will not repaint.
Format
Formatting a profile for charts is often a challenge for traders, and this one is no exception. Varying zoom factors on your chart and the frequency of profile resets will require different profile formats. You can achieve a reasonable variety of effects by playing with the following input fields:
• "Resets on" controls how frequently new profiles are drawn. Spacing out profiles between bars can help make them more usable.
• "Levels" determines the maximum quantity of levels displayed.
• "Offset" allows you to shift the profile horizontally.
• "Profile size" affects the global size of the profile.
• Another "Size" field provides control over the size of the totals displayed above the profile.
• "Maximum line length" controls how far away from the center of the bar the lines will stretch left and right.
Colors
The color and brightness of levels and totals always allows you to determine the winning side between up and down values. On double-sided profiles, each side is always of one color, since the left side is down values and the right side, up values. However, the losing side is colored with half its brightness, so the emphasis is put on the winning side. When there is no winner, the toned-down version of each color is used for both sides. Single-sided profiles use the up and down colors in full brightness on the same side. Which one is used reflects the winning side.
Candles
The indicator can color candle bodies and borders independently. If you choose to do so, you may want to disable the chart's bars by using the eye icon near the symbol's name.
Tooltips
A tooltip showing the value of each level is available. If they do not appear when hovering over levels, select the indicator by clicking on its chart name. This should get the tooltips working.
Data Window
As usual, I provide key values in the Data Window, so you can track them. If you compare total realtime volumes for the profile and the built-in "Volume" indicator, you may see variations at some points. They are due to the different mechanisms running each program. In my experience, the values from the built-in don't always update as often as those of the profile, but they eventually catch up.
█ LIMITATIONS
• The levels do not appear exactly at the position they are calculated. They are positioned slightly lower than their actual price levels.
• Drawing a 20-level double-sided profile with totals requires 42 labels. The script will only display the last 500 labels,
so the number of levels you choose affects how many past profiles will remain visible.
• The script is quite taxing, which will sometimes make the chart's tab less responsive.
• When you first load the indicator on a chart, it will begin calculating from that moment; it will not take into account prior chart activity.
• If you let the script run long enough when using profile reset criteria that make profiles last for a long time, the script will eventually run out of memory,
as it will be tracking unmanageable amounts of chart updates. I don't know the exact quantity of updates that will cause this,
but the script can handle upwards of 60K updates per profile, which should last 1D except on the most active markets. You can follow the number of updates in the Data Window.
• The indicator's nature makes it more useful at very small timeframes, typically in the sub 15min realm.
• The Weis Wave trend detection used here has nothing to do with how David Weis detects trend changes.
LazyBear's version was a port of a port, so we are a few generations removed from the Weis technique, which uses reversals by a price unit.
I believe the version used here is useful nonetheless because it complements Supertrend rather well.
█ NOTES
The aggregated view that volume and tick profiles calculate for traders is a good example of one of the most useful things software can do for traders: look at things from a methodical, mathematical perspective, and present results in a meaningful way. Profiles are powerful because, if the volume data they use is of good enough quality, they tell us what levels are important for traders, regardless of the nature or rationality of the methods traders have used to determine those levels. Profiles don't care whether traders use the news, fundamentals, Fib numbers, pivots, or the phases of the moon to find "their" levels. They don't attempt to forecast or explain markets. They show us real stuff containing zero uncertainty, i.e., what HAS happened. I like this.
The indicator's "VPAA" chart name represents four of the five dimensions the indicator displays: volume, price, activity and age. The time dimension is implied by the fact it's a profile — and I couldn't find a proper place for a "T" in there )
I have not included alerts in the script. I may do so in the future.
For the moment, I have no plans to write a profile indicator that works on historical bars. TradingView's volume profiles already do that, and they run much faster than Pine versions could, so I don't see the point in spending efforts on a poor ersatz.
For Pine Coders
• The script uses labels that draw varying quantities of characters to break the limitation constraining other Pine plots/lines to bar boundaries.
• The code's structure was optimized for performance. When it was feasible, global arrays, "input" and other variables were used from functions,
sacrificing function readability and portability for speed. Code was also repeated in some places, to avoid the overhead of frequent function calls in high-traffic areas.
• I wrote my script using the revised recommendations in the Style Guide from the Pine v5 User Manual.
█ THANKS
• To Duyck for his function that sorts an array while keeping it in synch with another array.
The `sortTwoArrays()` function in my script is derived from the Pine Wizard 's code.
• To the one and only Maestro, RicardoSantos , the creative volcano who worked hard to write a function to produce fixed-width, figure space-padded numeric values.
A change in design made the function unnecessary in this script, but I am grateful to you nonetheless.
• To midtownskr8guy , another Pine Wizard who is also a wizard with colors. I use the colors from his Pine Color Magic and Chart Theme Simulator constantly.
• Finally, thanks to users of my earlier "Delta Volume" scripts. Comments and discussions with them encouraged me to persist in figuring out how to achieve what this indicator does.

[blackcat] L2 Ehlers Empirical Mode TraderCircumstance Remarks: Because of my carelessness, the script of the same name that I posted before was banned and hidden because the description contained content that violated the TradingView House Rule. After communicating with the MOD, I corrected the description and obtained permission to publish it again. I hereby declare. Sorry for the inconvenience!
Level: 2
Background
John F. Ehlers introuced Empirical Mode Trader Indicator in Mar, 2010.
Function
In his article “Empirical Mode Decomposition,” John Ehlers and Ric Way suggest using methods based on bandpass filtering to distinguish trending from cycling markets. The article’s trading suggestions were used to create the Empirical Mode strategy given here for pine v4 script. If the strategy determines that the marke is in trending mode, then the strategy is allowed to trade with the trend — either long, in uptrends, or short, in downtrends. If the indicator determines that the market is in cycling mode, then the strategy allows trading cycle extremes, using Bollinger bands to trigger entries. You can do this by Choosing either cycle or trend mode at inputs.
Key Signal
Trend ---> Trend signal
FracAvgPeak ---> Upper band signal
FracAvgValley ---> Lower band signal
Pros and Cons
100% John F. Ehlers definition translation, even variable names are the same. This help readers who would like to use pine to read his book.
Remarks
The 75th script for Blackcat1402 John F. Ehlers Week publication.
Readme
In real life, I am a prolific inventor. I have successfully applied for more than 60 international and regional patents in the past 12 years. But in the past two years or so, I have tried to transfer my creativity to the development of trading strategies. Tradingview is the ideal platform for me. I am selecting and contributing some of the hundreds of scripts to publish in Tradingview community. Welcome everyone to interact with me to discuss these interesting pine scripts.
The scripts posted are categorized into 5 levels according to my efforts or manhours put into these works.
Level 1 : interesting script snippets or distinctive improvement from classic indicators or strategy. Level 1 scripts can usually appear in more complex indicators as a function module or element.
Level 2 : composite indicator/strategy. By selecting or combining several independent or dependent functions or sub indicators in proper way, the composite script exhibits a resonance phenomenon which can filter out noise or fake trading signal to enhance trading confidence level.
Level 3 : comprehensive indicator/strategy. They are simple trading systems based on my strategies. They are commonly containing several or all of entry signal, close signal, stop loss, take profit, re-entry, risk management, and position sizing techniques. Even some interesting fundamental and mass psychological aspects are incorporated.
Level 4 : script snippets or functions that do not disclose source code. Interesting element that can reveal market laws and work as raw material for indicators and strategies. If you find Level 1~2 scripts are helpful, Level 4 is a private version that took me far more efforts to develop.
Level 5 : indicator/strategy that do not disclose source code. private version of Level 3 script with my accumulated script processing skills or a large number of custom functions. I had a private function library built in past two years. Level 5 scripts use many of them to achieve private trading strategy.
[blackcat] L2 Ehlers Sine Wave Coupled Eight Planetary CycleLevel: 2
Background
Have you considered that factors outside the Earth will be related to macro market trends? Let’s discuss the relationship between the planetary movement in the Galaxy and the market movement on Earth today! Although I said that, you may have laughed out in front of the screen, but the calculations in this script are entirely based on astronomical data and mathematical relationships.
Your next question may be why you compare the movements of the eight planets and the laws of the market on the earth together? My answer comes from a Cybernetic Sine Wave indicator proposed by Dr. John F. Ehlers.
Function
L2 Ehlers Sine Wave Coupled Eight Planetary Cycle first converts the astronomical data of the eight major planets into planetary aspects/phases through mathematical relationships. Planetary aspects/phases can provide the historical and current relative positions of each planet in the mathematical triangle relationship. We can use a simple mathematical sine formula to constrain the planet's trajectory between -1 and 1, which is what we often call a sine wave.
The relationship between the sine wave and the market can be extracted from the theory of John F. Ehlers. In Ehlers' theory, market price can be modeled by the trend and cycle modes. And in his works, there are many indicators of how to completely remove the trend in the market price and only leave the cycle mode data. The Cybernetic Sine Wave indicator is exactly the cycle mode data after the market trend is stripped, and expressed in the form of a sine wave.
If you can read to here with patience, you must also be aware of the premise that the trajectories of the eight planets and the laws of the earth market can be coupled: the trajectory of the sine wave mode. Therefore, this indicator is a tool for comparing and analyzing the two in the same chart. I hope you like it.
Finally, in order to benchmark the trajectories of the eight planets and the specific market on the earth, a starting point in time is particularly important. This is the base date of the market index to be analyzed. It is the year, month, and day data specified by the index, which needs to be input by the user when analyzing a specific stock index. For example, the base date of the S&P 500 index is January 3, 1928. This date needs to be entered into the indicator to analyze the SPX500.
Key Signal
Mercury_trail ---> smoothed Mercury orbit sine wave
Venus_trail ---> smoothed Venus orbit sine wave
Earth_trail ---> smoothed Earth orbit sine wave
Earth_mirror ---> smoothed Earth mirrored orbit sine wave
Mars_trail ---> smoothed Mars orbit sine wave
Jupiter_trail ---> smoothed Jupiter orbit sine wave
Saturn_trail ---> smoothed Saturn orbit sine wave
Uranus_trail ---> smoothed Uranus orbit sine wave
Neptune_trail ---> smoothed Neptune orbit sine wave
Aspect 0, 45, 90, 225, 270 deg ---> key planet aspects
ehlersine ---> Ehlers Cybernetic Sine Wave
ehlerslsine ---> Ehlers Cybernetic Lead Sine Wave
Pros and Cons
This is a technical indicator that I have come up with on a whim, and the laws of planetary operation and the operation of the Earth market are still being explored. Hope that interested friends will share your new discoveries.
Remarks
To celebrate I released the 50th technical indicator script on TV!
Courtesy of @sal157011 John Ehlers "Cybernetic Sine Wave" indicator, I converted it from pine v2 to pine v4 in this script.
Readme
In real life, I am a prolific inventor. I have successfully applied for more than 60 international and regional patents in the past 12 years. But in the past two years or so, I have tried to transfer my creativity to the development of trading strategies. Tradingview is the ideal platform for me. I am selecting and contributing some of the hundreds of scripts to publish in Tradingview community. Welcome everyone to interact with me to discuss these interesting pine scripts.
The scripts posted are categorized into 5 levels according to my efforts or manhours put into these works.
Level 1 : interesting script snippets or distinctive improvement from classic indicators or strategy. Level 1 scripts can usually appear in more complex indicators as a function module or element.
Level 2 : composite indicator/strategy. By selecting or combining several independent or dependent functions or sub indicators in proper way, the composite script exhibits a resonance phenomenon which can filter out noise or fake trading signal to enhance trading confidence level.
Level 3 : comprehensive indicator/strategy. They are simple trading systems based on my strategies. They are commonly containing several or all of entry signal, close signal, stop loss, take profit, re-entry, risk management, and position sizing techniques. Even some interesting fundamental and mass psychological aspects are incorporated.
Level 4 : script snippets or functions that do not disclose source code. Interesting element that can reveal market laws and work as raw material for indicators and strategies. If you find Level 1~2 scripts are helpful, Level 4 is a private version that took me far more efforts to develop.
Level 5 : indicator/strategy that do not disclose source code. private version of Level 3 script with my accumulated script processing skills or a large number of custom functions. I had a private function library built in past two years. Level 5 scripts use many of them to achieve private trading strategy.
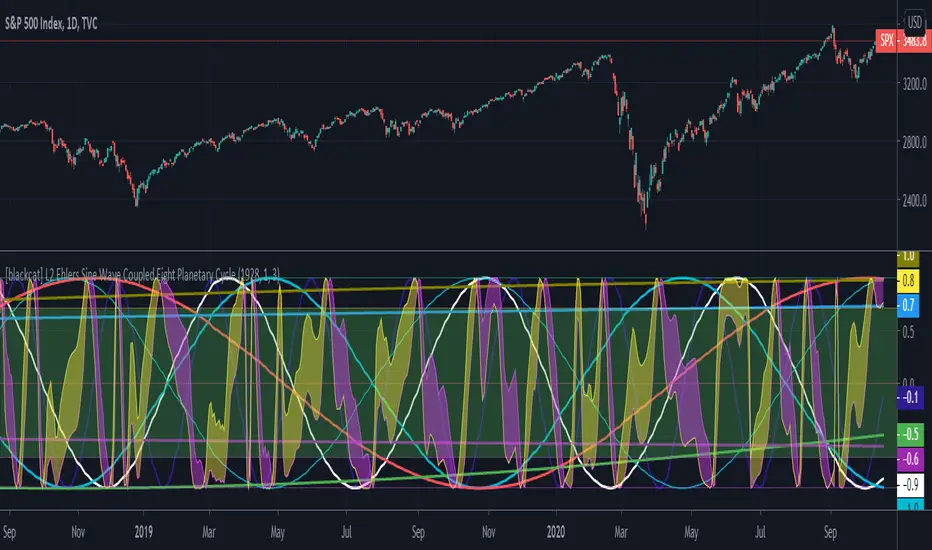
L1 Moving Average Fingerprint for Long EntryLevel: 1
Background
This script combines moving average processing with highest high and lowest low to disclose the "fingerprint" of a specific trading pair to describe its unique behavior.
Function
Moving Average Fingerprint for Long Entry is a Level 1 pine script. It utilize several moving average of inherent highest high and lowest low and combine them with customized fingerprint coefficients to depict the unique behavior of a specific trading pair across multiple markets for long entry point identification.
Key Signal
FingerPrint1~6 are basic-level fingerprints with moving average of highest high and lowest low.
FingerPrint7~8 are composite fingerprint definitions with coefficients/weights,where coefficients/weights need to be tuned to discover the inherent "fingerprint" of a specific trading pair.
FingerPrint10~12 are composite fingerprint calculation for long entry alerts
ReadytoLong is a long entry filter where long entry point may happen within it. By using crossover() function to a customized threshold value, you can define accurate long entries.
Pros and Cons
Pros:
1. Combine moving average and extreme points to disclose a trading pair behavior.
2. Smart to tune specific set of parameters to obtain unique fingerprints of trading pairs.
3. Smart position sizing scheme by adjusting the threshold values.
Cons:
1. Require tune input parameters for each trading pair in a specific period and time frame.
2. Only long entry was studied, no short entry and re-entry are available yet to form as a trading system.
3. "ReadytoLong" is an inaccurate range where multiple long entries may happen at improper points in chop market.
4. Complex input parameters to obtain a unique fingerprint set.
Remarks
Although I wrote pine script for more than two years, this is the first script published in the community. I will publish more with my works in this platform.
Hope the community can improve this concept and make it as a trading system.
Readme
In real life, I am a prolific inventor. I have successfully applied for more than 60 international and regional patents in the past 12 years. But in the past two years or so, I have tried to transfer my creativity to the development of trading strategies. Tradingview is the ideal platform for me. I am selecting and contributing some of the hundreds of scripts to publish in Tradingview community. Welcome everyone to interact with me to discuss these interesting pine scripts.
The scripts posted are categorized into 5 levels according to my efforts or manhours put into these works.
Level 1 : interesting script snippets or distinctive improvement from classic indicators or strategy. Level 1 scripts can usually appear in more complex indicators as a function module or element.
Level 2 : composite indicator/strategy. By selecting or combining several independent or dependent functions or sub indicators in proper way, the composite script exhibits a resonance phenomenon which can filter out noise or fake trading signal to enhance trading confidence level.
Level 3 : comprehensive indicator/strategy. They are simple trading systems based on my strategies. They are commonly containing several or all of entry signal, close signal, stop loss, take profit, re-entry, risk management, and position sizing techniques. Even some interesting fundamental and mass psychological aspects are incorporated.
Level 4 : script snippets or functions that do not disclose source code. Interesting element that can reveal market laws and work as raw material for indicators and strategies. If you find Level 1~2 scripts are helpful, Level 4 is a private version that took me far more efforts to develop.
Level 5 : indicator/strategy that do not disclose source code. private version of Level 3 script with my accumulated script processing skills or a large number of custom functions. I had a private function library built in past two years. Level 5 scripts use many of them to achieve private trading strategy.

PSv4.0 Limited Array Support Super HackThis is my "PSv4.0 Limited Array Support Super Hack", derived from MichelT's Workaround for Arrays in pine and Bubble sort script, except this utilizes line.new() to obtain one array with up to 100 indices. I provided functions that may be syntactically comparable in operation to the array class we should get with PSv5.0 when that arrives. I have no clue when that ETA shall be either, so your guess is as good as mine. Due to the complexity of the script, I would ONLY recommend this script's functions for reuse by advanced Pine programmers, not newcomers to Pine Script.
Notice: FYI, support for these functions will be limited to only errata with the included functions. Honestly, I don't have an abundance of time on a daily basis to assist members with incorporation into their newly developed scripts. I hope you will understand.
The intention of this script is to provide Pine developers with one large array having up to 100 indices until we have full native array support in the future. Availability of full use of the array is only obtained when bar_index is indicesCount-1, so bear that in mind. This script is so computationally expensive, I would only advise using it "as is" on 5Y and All Charts at it's current initial release. On smaller sampling rates such as 1D, 5D and 1M... it has a tendency to encounter runtime errors such as this message: "Calculation timed out. Remove the indicator and reapply it to the chart". I just switch to a larger sampling interval - 5Y or All. I believe this is occurring due mostly to prng() generating thousands of random floating point numbers, PLUS the overhead of using line.new() for something it wasn't originally intended for. It does also use 64 plots in full color, maxing out the plotting capabilities of Pine as well. With usage of the array functions alone in your code, I anticipate those scripts to be more server friendly.
Basically this scripts functionality, as is, generates 32 pseudorandom numbers per bar in a sky blue birds nest of random numbers. It then sorts them numerically and plots them once again in a visually stunning rainbow spectrum. You will notice the plot()s colors will invert when the sorting order is changed in Settings. I commented out a lot of plot()s because we are limited to a maximum of 64 plot()s. By commenting and uncommenting with highlighted text blocks and + , you may alter the scripts appearance when done properly.
Overall, I hope you find it useful with incorporating expected array functionality that will perpetuate the novel development of next generation indicators in Pine Script version 4.0 . Once again, check out MichelT's brilliantly crafted script mentioned above. You may be able to use both scripts incorporated into an all-in-one to have dual array support, BUT I have not tested this yet, be forewarned. I hope the community contribution of this script in open source is of some benefit to those who can utilize it properly. As always, I have included advanced Pine programming techniques that conform to proper "Pine Etiquette", so this script is more than just a complex array provision...
The comments section below is solely just for commenting and other remarks, ideas, compliments, etc... regarding only this indicator, not others. When available time provides itself, I will consider your inquiries, thoughts, and concepts presented below in the comments section, should you have any questions or comments regarding this indicator. When my indicators achieve more prevalent use by TV members, I may implement more ideas when they present themselves as worthy additions. As always, "Like" it if you simply just like it with a proper thumbs up, and also return to my scripts list occasionally for additional postings. Have a profitable future everyone!
Day trading volume based levels by VhatkarThis script identifies dynamic support and resistance levels based on volume and price action analysis. It uses a unique algorithm that combines volume force calculations with pivot points to determine key levels where price is likely to react.
Originality and Usefulness :
Innovative Volume Force Calculation : The script calculates upforce and downforce based on volume and price movement, providing a novel insight into buying and selling pressure. Unlike traditional volume indicators, this approach offers a more nuanced understanding of market dynamics.
Dynamic Pivot Points : Pivot points are dynamically adjusted based on volume force and highest high calculations, unlike conventional static pivot points. This makes the levels more responsive to real-time market conditions, offering traders a competitive edge.
Adaptive Target Levels : The script sets target and stop prices for both long and short positions, with adjustable percentages based on the chosen timeframe. This feature is particularly useful for day traders looking for precise entry and exit points.
Unique Timeframe Adjustments : The script includes specific adjustments for different timeframes (e.g., 15m, 30m, 60m), optimizing the support and resistance levels for day trading strategies. This adaptability is not commonly found in existing open-source scripts.
Volume-Weighted Adjustments : The integration of VWAP (Volume-Weighted Average Price) into the volume force calculation adds an extra layer of accuracy, helping traders make more informed decisions.
Comprehensive Visual Representation : The script offers clear visual plots of entry, target, and stop levels, along with color-coded fill areas that indicate different target zones. This visual clarity enhances user experience and decision-making.
Unique Features Compared to Open-Source Scripts :
Advanced Volume Force Algorithm : While many open-source scripts rely solely on price action or basic volume indicators, this script integrates a sophisticated volume force algorithm. This unique approach allows traders to identify more accurate support and resistance levels based on real market activity.
Dynamic and Adaptive Pivot Points : Unlike traditional open-source scripts that use static pivot points, this script dynamically adjusts pivot points based on the highest high and volume force. This dynamic adjustment provides a more precise and adaptable analysis suitable for various market conditions.
Integrated VWAP Calculation : Incorporating VWAP into volume force calculations adds an extra dimension of accuracy, allowing for more reliable trading signals. This feature differentiates the script from simpler open-source alternatives that may not include such advanced calculations.
How to Use :
Apply the Script : Add the "Vhatkar Dynamic S/R Levels" script to your chart. Make sure your chart has volume data as the script relies on volume calculations.
Select Timeframe : The script is designed for day trading timeframes such as 5m, 15m, and 30m. Ensure you are using one of these timeframes for optimal performance.
Adjust Parameters :
Target Lines : Set the number of target lines using the SLRange input. Increase the count if fewer lines are visible or decrease if too many lines are cluttering the chart.
Interpreting Signals :
Long Entries : When the close price is above the pivot point, the script plots potential long entry points and target levels (TP1, TP2, TP3) as well as a stop-loss level.
Short Entries : When the close price is below the pivot point, the script plots potential short entry points and target levels (TP1, TP2, TP3) as well as a stop-loss level.
Visual Aids : Use the color-coded fill areas to quickly identify target zones and stop levels.
Trade Management : Utilize the plotted entry, target, and stop levels to manage your trades. Adjust your trading strategy based on the levels provided by the script.
Usage :
Designed for day trading on timeframes such as 5m, 15m, and 30m.
Provides clear visual plots of entry, target, and stop levels.
Offers flexibility with adjustable parameters to suit different trading styles.

Using `varip` variables [PineCoders]█ OVERVIEW
The new varip keyword in Pine can be used to declare variables that escape the rollback process, which is explained in the Pine User Manual's page on the execution model . This publication explains how Pine coders can use variables declared with varip to implement logic that was impossible to code in Pine before, such as timing events during the realtime bar, or keeping track of sequences of events that occur during successive realtime updates. We present code that allows you to calculate for how much time a given condition is true during a realtime bar, and show how this can be used to generate alerts.
█ WARNINGS
1. varip is an advanced feature which should only be used by coders already familiar with Pine's execution model and bar states .
2. Because varip only affects the behavior of your code in the realtime bar, it follows that backtest results on strategies built using logic based on varip will be meaningless,
as varip behavior cannot be simulated on historical bars. This also entails that plots on historical bars will not be able to reproduce the script's behavior in realtime.
3. Authors publishing scripts that behave differently in realtime and on historical bars should imperatively explain this to traders.
█ CONCEPTS
Escaping the rollback process
Whereas scripts only execute once at the close of historical bars, when a script is running in realtime, it executes every time the chart's feed detects a price or volume update. At every realtime update, Pine's runtime normally resets the values of a script's variables to their last committed value, i.e., the value they held when the previous bar closed. This is generally handy, as each realtime script execution starts from a known state, which simplifies script logic.
Sometimes, however, script logic requires code to be able to save states between different executions in the realtime bar. Declaring variables with varip now makes that possible. The "ip" in varip stands for "intrabar persist".
Let's look at the following code, which does not use varip :
//@version=4
study("")
int updateNo = na
if barstate.isnew
updateNo := 1
else
updateNo := updateNo + 1
plot(updateNo, style = plot.style_circles)
On historical bars, barstate.isnew is always true, so the plot shows a value of "1". On realtime bars, barstate.isnew is only true when the script first executes on the bar's opening. The plot will then briefly display "1" until subsequent executions occur. On the next executions during the realtime bar, the second branch of the if statement is executed because barstate.isnew is no longer true. Since `updateNo` is initialized to `na` at each execution, the `updateNo + 1` expression yields `na`, so nothing is plotted on further realtime executions of the script.
If we now use varip to declare the `updateNo` variable, the script behaves very differently:
//@version=4
study("")
varip int updateNo = na
if barstate.isnew
updateNo := 1
else
updateNo := updateNo + 1
plot(updateNo, style = plot.style_circles)
The difference now is that `updateNo` tracks the number of realtime updates that occur on each realtime bar. This can happen because the varip declaration allows the value of `updateNo` to be preserved between realtime updates; it is no longer rolled back at each realtime execution of the script. The test on barstate.isnew allows us to reset the update count when a new realtime bar comes in.
█ OUR SCRIPT
Let's move on to our script. It has three parts:
— Part 1 demonstrates how to generate alerts on timed conditions.
— Part 2 calculates the average of realtime update prices using a varip array.
— Part 3 presents a function to calculate the up/down/neutral volume by looking at price and volume variations between realtime bar updates.
Something we could not do in Pine before varip was to time the duration for which a condition is continuously true in the realtime bar. This was not possible because we could not save the beginning time of the first occurrence of the true condition.
One use case for this is a strategy where the system modeler wants to exit before the end of the realtime bar, but only if the exit condition occurs for a specific amount of time. One can thus design a strategy running on a 1H timeframe but able to exit if the exit condition persists for 15 minutes, for example. REMINDER: Using such logic in strategies will make backtesting their complete logic impossible, and backtest results useless, as historical behavior will not match the strategy's behavior in realtime, just as using `calc_on_every_tick = true` will do. Using `calc_on_every_tick = true` is necessary, by the way, when using varip in a strategy, as you want the strategy to run like a study in realtime, i.e., executing on each price or volume update.
Our script presents an `f_secondsSince(_cond, _resetCond)` function to calculate the time for which a condition is continuously true during, or even across multiple realtime bars. It only works in realtime. The abundant comments in the script hopefully provide enough information to understand the details of what it's doing. If you have questions, feel free to ask in the Comments section.
Features
The script's inputs allow you to:
• Specify the number of seconds the tested conditions must last before an alert is triggered (the default is 20 seconds).
• Determine if you want the duration to reset on new realtime bars.
• Require the direction of alerts (up or down) to alternate, which minimizes the number of alerts the script generates.
The inputs showcase the new `tooltip` parameter, which allows additional information to be displayed for each input by hovering over the "i" icon next to it.
The script only displays useful information on realtime bars. This information includes:
• The MA against which the current price is compared to determine the bull or bear conditions.
• A dash which prints on the chart when the bull or bear condition is true.
• An up or down triangle that prints when an alert is generated. The triangle will only appear on the update where the alert is triggered,
and unless that happens to be on the last execution of the realtime bar, it will not persist on the chart.
• The log of all triggered alerts to the right of the realtime bar.
• A gray square on top of the elapsed realtime bars where one or more alerts were generated. The square's tooltip displays the alert log for that bar.
• A yellow dot corresponding to the average price of all realtime bar updates, which is calculated using a varip array in "Part 2" of the script.
• Various key values in the Data Window for each parts of the script.
Note that the directional volume information calculated in Part 3 of the script is not plotted on the chart—only in the Data Window.
Using the script
You can try running the script on an open market with a 30sec timeframe. Because the default settings reset the duration on new realtime bars and require a 20 second delay, a reasonable amount of alerts will trigger.
Creating an alert on the script
You can create a script alert on the script. Keep in mind that when you create an alert from this script, the duration calculated by the instance of the script running the alert will not necessarily match that of the instance running on your chart, as both started their calculations at different times. Note that we use alert.freq_all in our alert() calls, so that alerts will trigger on all instances where the associated condition is met. If your alert is being paused because it reaches the maximum of 15 triggers in 3 minutes, you can configure the script's inputs so that up/down alerts must alternate. Also keep in mind that alerts run a distinct instance of your script on different servers, so discrepancies between the behavior of scripts running on charts and alerts can occur, especially if they trigger very often.
Challenges
Events detected in realtime using variables declared with varip can be transient and not leave visible traces at the close of the realtime bar, as is the case with our script, which can trigger multiple alerts during the same realtime bar, when the script's inputs allow for this. In such cases, elapsed realtime bars will be of no use in detecting past realtime bar events unless dedicated code is used to save traces of events, as we do with our alert log in this script, which we display as a tooltip on elapsed realtime bars.
█ NOTES
Realtime updates
We have no control over when realtime updates occur. A realtime bar can open, and then no realtime updates can occur until the open of the next realtime bar. The time between updates can vary considerably.
Past values
There is no mechanism to refer to past values of a varip variable across realtime executions in the same bar. Using the history-referencing operator will, as usual, return the variable's committed value on previous bars. If you want to preserve past values of a varip variable, they must be saved in other variables or in an array .
Resetting variables
Because varip variables not only preserve their values across realtime updates, but also across bars, you will typically need to plan conditions that will at some point reset their values to a known state. Testing on barstate.isnew , as we do, is a good way to achieve that.
Repainting
The fact that a script uses varip does not make it necessarily repainting. A script could conceivably use varip to calculate values saved when the realtime bar closes, and then use confirmed values of those calculations from the previous bar to trigger alerts or display plots, avoiding repaint.
timenow resolution
Although the variable is expressed in milliseconds it has an actual resolution of seconds, so it only increments in multiples of 1000 milliseconds.
Warn script users
When using varip to implement logic that cannot be replicated on historical bars, it's really important to explain this to traders in published script descriptions, even if you publish open-source. Remember that most TradingViewers do not know Pine.
New Pine features used in this script
This script uses three new Pine features:
• varip
• The `tooltip` parameter in input() .
• The new += assignment operator. See these also: -= , *= , /= and %= .
Example scripts
These are other scripts by PineCoders that use varip :
• Tick Delta Volume , by RicadoSantos .
• Tick Chart and Volume Info from Lower Time Frames by LonesomeTheBlue .
Thanks
Thanks to the PineCoders who helped improve this publication—especially to bmistiaen .
Look first. Then leap.

[blackcat] L2 Price Envelope TrackerLevel: 2
Background
Price envelopes sare shown at a set percentage above and below a moving average. They are used to indicate overbought and oversold levels and can be traded individually or in conjunction with a momentum indicator.
Function
L2 Price Envelope Tracker is an innovative indicator that use customized envelope of price to disclose overbought and oversold periods. With this function, long and short entries can be further developped in this pine script.
Key Signal
sma5 --> typical price moving average line
resistance --> upper envelope as resistance line
support ---> lower envelope as support line
Pros and Cons
Pros:
1. easy observe overbought and oversold zone
2. disclose exact long and short entries in overbought and oversold zones
Cons:
1. Only applicable for the trading pairs that support financial() functions. crypto/xau/xag/indice are not applicable
2. Need to tune r1 and s1 for different trading pairs
Remarks
NA
Readme
In real life, I am a prolific inventor. I have successfully applied for more than 60 international and regional patents in the past 12 years. But in the past two years or so, I have tried to transfer my creativity to the development of trading strategies. Tradingview is the ideal platform for me. I am selecting and contributing some of the hundreds of scripts to publish in Tradingview community. Welcome everyone to interact with me to discuss these interesting pine scripts.
The scripts posted are categorized into 5 levels according to my efforts or manhours put into these works.
Level 1 : interesting script snippets or distinctive improvement from classic indicators or strategy. Level 1 scripts can usually appear in more complex indicators as a function module or element.
Level 2 : composite indicator/strategy. By selecting or combining several independent or dependent functions or sub indicators in proper way, the composite script exhibits a resonance phenomenon which can filter out noise or fake trading signal to enhance trading confidence level.
Level 3 : comprehensive indicator/strategy. They are simple trading systems based on my strategies. They are commonly containing several or all of entry signal, close signal, stop loss, take profit, re-entry, risk management, and position sizing techniques. Even some interesting fundamental and mass psychological aspects are incorporated.
Level 4 : script snippets or functions that do not disclose source code. Interesting element that can reveal market laws and work as raw material for indicators and strategies. If you find Level 1~2 scripts are helpful, Level 4 is a private version that took me far more efforts to develop.
Level 5 : indicator/strategy that do not disclose source code. private version of Level 3 script with my accumulated script processing skills or a large number of custom functions. I had a private function library built in past two years. Level 5 scripts use many of them to achieve private trading strategy.
